K-Means Clustering
K-means is a popular unsupervised machine learning algorithm used for clustering tasks. It partitions a dataset into \( K \) distinct, non-overlapping groups or clusters based on feature similarity. The algorithm aims to group data points so that points in each cluster are more similar to each other than to those in other clusters.
Algorithm
- Initialization: Choose the number of clusters \( K \) and randomly initialize \( K \) centroids from the data points.
- Assignment Step: Assign each data point to the nearest centroid based on a distance metric (usually Euclidean distance).
- Update Step: Calculate the new centroids by taking the mean of all the data points assigned to each cluster.
- Convergence Check: Repeat the assignment and update steps until centroids no longer change significantly or a maximum number of iterations is reached.
Mathematical Formulation
The K-means algorithm minimizes the total intra-cluster variance:
$$ J = \sum_{i=1}^{K} \sum_{x_j \in C_i} \| x_j - \mu_i \|^2 $$- \( J \): Objective function to minimize (sum of squared distances).
- \( K \): Number of clusters.
- \( C_i \): Set of data points in cluster \( i \).
- \( x_j \): Data point in cluster \( i \).
- \( \mu_i \): Centroid of cluster \( i \).
Code
from sklearn.cluster import KMeans
from sklearn.datasets import make_blobs
import matplotlib.pyplot as plt
# Generate synthetic data
data, _ = make_blobs(n_samples=300, random_state=42)
# Train K-Means model
model = KMeans(random_state=42, n_clusters=5, n_init='auto')
model.fit(data)
# Extract cluster labels and centroids
labels = model.labels_
centroids = model.cluster_centers_
# Plot clusters
plt.scatter(data[:, 0], data[:, 1], c=labels, cmap='viridis', marker='o', alpha=0.6)
plt.scatter(centroids[:, 0], centroids[:, 1], c='red', marker='X', s=200, label='Centroids')
plt.title('K-Means Clustering')
plt.xlabel('Feature 1')
plt.ylabel('Feature 2')
plt.legend()
plt.show()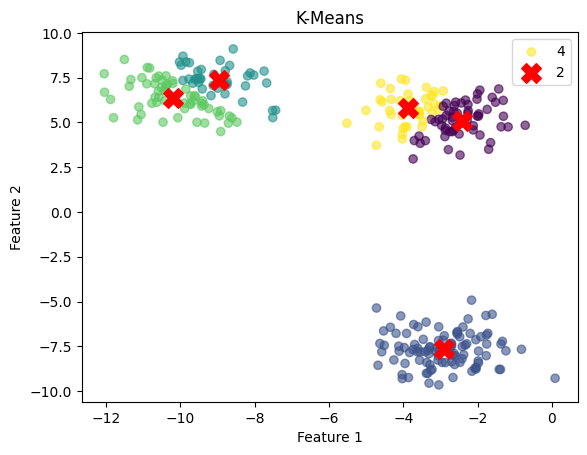 K-Means Clustering Visualization
Choosing the Number of Clusters (\( K \))
- Elbow Method: Plot the total within-cluster variance (inertia) against the number of clusters. The "elbow" point indicates a good choice for \( K \).
- Silhouette Score: Measures how similar a point is to its own cluster compared to other clusters. Higher scores indicate better-defined clusters.
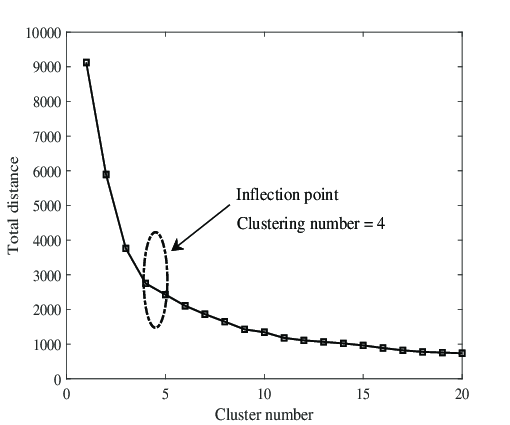 Elbow Method for Choosing \( K \)
Prediction Example
# Predict cluster for new data points
predictions = model.predict([[2, -4], [6, 6], [6, -2]])
print("Cluster Predictions:", predictions)
Cluster Predictions: [0, 4, 3]Advantages, Limitations, and Applications
| Advantages | Limitations | Applications |
|---|---|---|
| Simple and easy to implement. | Requires specifying \( K \) in advance. | Customer Segmentation: Grouping customers based on purchasing behavior. |
| Computationally efficient for large datasets. | Sensitive to initialization of centroids. | Image Compression: Reducing the number of colors in an image. |
| Scalable for high-dimensional data. | Assumes spherical clusters, which may not always be valid. | Anomaly Detection: Identifying outliers based on cluster distance. |
| Sensitive to outliers, which can skew results. |