Linear Regression
Linear regression is a fundamental statistical method used in machine learning and data analysis to model the relationship between a dependent variable (target) and one or more independent variables (features). It assumes a linear relationship and aims to find the best-fitting line that minimizes the difference between the observed and predicted values.
Types of Linear Regression
- Simple Linear Regression: Involves a single independent variable. $$ y = \beta_0 + \beta_1 x + \epsilon $$
- Multiple Linear Regression: Involves two or more independent variables. $$ y = \beta_0 + \beta_1 x_1 + \beta_2 x_2 + \ldots + \beta_n x_n + \epsilon $$
Assumptions of Linear Regression
- Linearity: The relationship between the independent and dependent variables is linear.
- Independence: Observations are independent of each other.
- Homoscedasticity: The variance of the residuals is constant.
- Normality: The residuals are normally distributed.
- No Multicollinearity: Independent variables should not be highly correlated.
Mathematical Formulation
The Ordinary Least Squares (OLS) method minimizes the squared differences between observed and predicted values:
$$ \text{Cost} = \sum_{i=1}^{m} (y_i - \hat{y}_i)^2 $$Code
import numpy as np
from sklearn.model_selection import train_test_split
from sklearn.linear_model import LinearRegression
import matplotlib.pyplot as plt
# Generate synthetic data
np.random.seed(42)
X = 2 * np.random.rand(100, 1)
y = 4 + 3 * X + np.random.rand(100, 1)
# Train-test split
X_train, X_test, y_train, y_test = train_test_split(X, y, train_size=0.7)
# Train the model
model = LinearRegression()
model.fit(X_train, y_train)
# Predictions
y_pred = model.predict(X_test)
# Plot the results
plt.scatter(X_test, y_test, color='blue', label='Actual')
plt.plot(X_test, y_pred, color='red', linewidth=2, label='Predicted')
plt.xlabel('X')
plt.ylabel('y')
plt.title('Linear Regression')
plt.legend()
plt.show()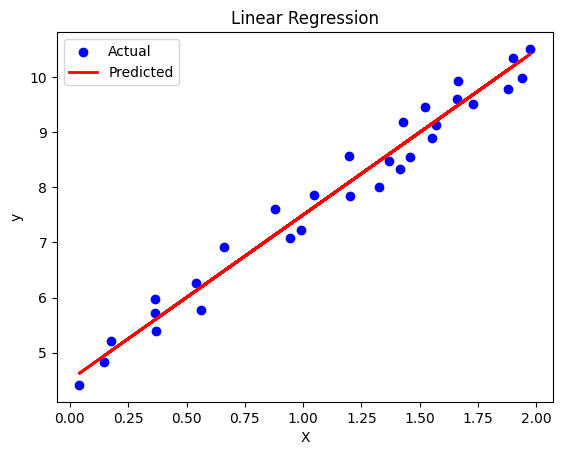 Linear Regression
Applications
- Economics: Predicting consumer spending, sales forecasts.
- Healthcare: Predicting patient outcomes based on health metrics.
- Finance: Risk assessment and asset returns prediction.
- Social Sciences: Analyzing relationships between social factors and outcomes.
Advantages and Limitations
| Advantages | Limitations |
|---|---|
| Simplicity: Easy to understand and interpret. | Linearity Assumption: Poor performance if the relationship is not linear. |
| Fast: Computationally efficient, even for large datasets. | Sensitivity to Outliers: Outliers can significantly affect model fit. |
| Well-studied: Robust theoretical foundations. | Overfitting: Too many variables may lead to overfitting. |